
Converters and technical calculators for industrial compressed-air systems.
Compressed air toolbox
Pressure
Pa, kPa, bar, psi, atm — absolute and gauge.
Results
- Pascals (Pa)
- — Pa
- Kilopascals (kPa)
- — kPa
- Kilopascals gauge (kPag)
- — kPag
- Megapascals (MPa)
- — MPa
- Bar
- — bar
- Bar gauge (barg)
- — barg
- PSI gauge (psig)
- — psig
- PSI absolute (psia)
- — psia
- Atmospheres (atm)
- — atm
Flow
m³/s, m³/min, m³/h, L/s, CFM, GPM.
Results
- Cubic meters / second (m³/s)
- — m³/s
- Cubic meters / minute (m³/min)
- — m³/min
- Cubic meters / hour (m³/h)
- — m³/h
- Liters / second (L/s)
- — L/s
- Cubic feet / minute (CFM)
- — CFM
- Gallons / minute (GPM)
- — GPM
Power
W, kW, HP, BTU/h.
Results
- Watts (W)
- — W
- Kilowatts (kW)
- — kW
- Horsepower (HP)
- — HP
- BTU / hour
- — BTU/h
Temperature
°C, °F, K.
Results
- Celsius (°C)
- — °C
- Fahrenheit (°F)
- — °F
- Kelvin (K)
- — K
Volume
m³, L, mL, ft³, gallons.
Results
- Cubic meters (m³)
- — m³
- Liters (L)
- — L
- Milliliters (mL)
- — mL
- Cubic feet (ft³)
- — pi³
- Gallons (gal)
- — gal
Weight
kg, g, lb, oz, tons.
Results
- Kilograms (kg)
- — kg
- Grams (g)
- — g
- Pounds (lb)
- — lb
- Ounces (oz)
- — oz
- Metric tons (t)
- — t
Length
m, cm, mm, yards, feet, inches.
Results
- Meters (m)
- — m
- Centimeters (cm)
- — cm
- Millimeters (mm)
- — mm
- Yards (yd)
- — vg
- Feet (ft)
- — pi
- Inches (in)
- — po
Standardised flow
SCFM (CAGI), ACFM (ISO 1217), Nm³/h, Nm³/min, DIN 1343 — with P/T/RH conditions.
| Flow | Unit | Pressure | Temp (°C) | RH (%) | SCFM | ACFM | Nm³/h | Nm³/min |
|---|---|---|---|---|---|---|---|---|
| | — | — | — | — | ||||
| | — | — | — | — | ||||
| | — | — | — | — | ||||
| | — | — | — | — |
SCFM = CAGI/ISO 1217 (1 bar abs, 20 °C). For standardised units the conditions are set automatically; only ACFM (actual conditions) is editable.
Total system volume
Cumulative internal volume: piping + receivers (2:1 elliptical heads).
Piping
| # | Inner dia. | Length | m³ | ft³ | gal |
|---|---|---|---|---|---|
| 1 | — | — | — | ||
| 2 | — | — | — | ||
| 3 | — | — | — | ||
| 4 | — | — | — |
Receivers
| # | Diameter | Length | Manual volume | m³ | ft³ | gal |
|---|---|---|---|---|---|---|
| 1 | — | — | — | |||
| 2 | — | — | — | |||
| 3 | — | — | — | |||
| 4 | — | — | — | |||
| Total volume | — | — | — | |||
Receivers: cylinder + 2:1 elliptical heads, rounded to the nearest standard size; a manual volume takes precedence when entered.
Pressure loss
Pipe pressure drop (Darcy–Weisbach, Swamee–Jain friction).
Pressure loss
- bar
- —bar
- kPa
- —kPa
Calculation details
- Friction factor
- —
- Velocity
- —ft/s
- Inner diameter
- —mm · —in
- Length
- —m · —ft
Standardized inner diameters: steel ASME B36.10 (Schedule 10 / 40 / 80), aluminum per EQOfluids chart (PN16 = 232 psi · PN70 = 1015 psi). Darcy–Weisbach, air properties @ 20 °C / 1 bar abs (ISO 1217).
Pipe sizing
Recommended pipe diameter by pressure drop and velocity (open/closed loop).
Open loop — pressure drop
| Pipe | Velocity | ΔP | |
|---|---|---|---|
| Under | — | — | — |
| Optimal | — | — | — |
| Over | — | — | — |
Open loop — velocity (≤ 35 ft/s)
| Pipe | Velocity | ΔP | |
|---|---|---|---|
| Under | — | — | — |
| Optimal | — | — | — |
| Over | — | — | — |
Closed loop — pressure drop
| Pipe | Velocity | ΔP | |
|---|---|---|---|
| Under | — | — | — |
| Optimal | — | — | — |
| Over | — | — | — |
Closed loop — velocity (≤ 35 ft/s)
| Pipe | Velocity | ΔP | |
|---|---|---|---|
| Under | — | — | — |
| Optimal | — | — | — |
| Over | — | — | — |
Closed loop (CAGI ½ rule): air travels at most half the length → pressure drop reduced by about one-half (CAGI ch.4); full flow (CAGI sets no “Q/2”), so velocity at full flow (upper bound). Velocity red if > 35 ft/s; ΔP red if above the limit.
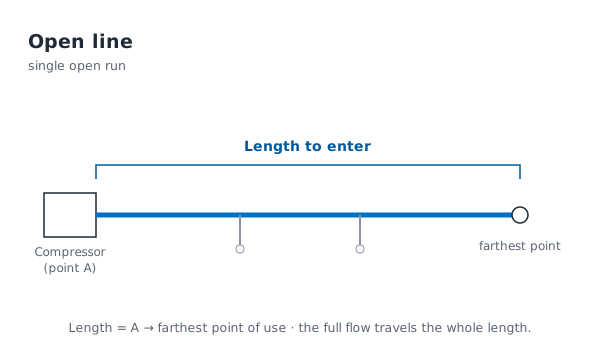
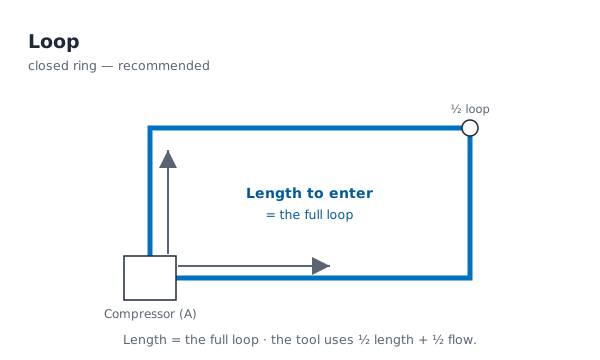
Enter the real pipe length. Open line: full Q and L. Loop (CAGI ½): air travels at most ½ the length → the tool computes over ½ length (drop ≈ half) at full flow, hence a smaller diameter than an open line.
Pressure drop — line vs loop
For a chosen diameter: actual pressure drop as an open line (Q, L) and a loop (≈ ½, CAGI rule).
Pressure drop
| Open line (Q, L) | Loop (½ — CAGI) | |
|---|---|---|
| Flow considered (SCFM) | — | — |
| Length (m) | — | — |
| Velocity (ft/s) | — | — |
| ΔP (psi) | — | — |
| ΔP (bar) | — | — |
Inner diameter used —mm · —in
Open line: full Q and L, from the compressor to the farthest point. Loop (CAGI): air travels at most half the loop length → pressure drop reduced by about one-half (CAGI ch.4); same pipe, same flow and velocity (upper-bound values). CAGI sets no “Q/2” (the per-direction flow reduction stays qualitative). Sizing criterion (as a % of pressure): whole system < 10 % of discharge (CAGI/DOE), main line 1–2 % (DOE); manufacturer references 5 % at 8 bar (Prevost), 2.5 %/100 m (Aircom) — in practice ~5 psi at 100–125 psi stays well under 10 %. Darcy–Weisbach, Swamee–Jain friction, air @ 20 °C / 1 bar abs (ISO 1217). Velocity red if > 35 ft/s.
Receiver storage
Volume required to ride through a demand event without dropping below the minimum pressure.
Required receiver volume
- Cubic feet
- —ft³
- Cubic meters
- —m³
- Net flow (demand − make-up)
- —SCFM
SCFM reference = 1 bar abs (CAGI / ISO 1217). The receiver only supplies the net flow (demand − compressor make-up). V = (Q_net · t · P_atm) / (60 · ΔP).
Compressor sizing
Required ACFM capacity for site altitude, temperature and humidity.
Scenario 1
Required capacity
- ACFM (min conditions)
- —ACFM
- ACFM (max conditions)
- —ACFM
Scenario 2
Required capacity
- ACFM (min conditions)
- —ACFM
- ACFM (max conditions)
- —ACFM
CAGI / ISO 1217 correction (Annex C). Recommended = worst case (max conditions).
Flow test
Compressor flow from a load/unload test (isothermal compression in a receiver).
How do you run the test?
- Close the isolation valve downstream of the receiver, then bleed it down to the load pressure (the compressor restarts).
- Time the rise between the load pressure and the unload pressure (the compressor stops).
- Enter the receiver volume, both pressures and the duration: the flow shows on the right.
Result
- Total volume
- —ft³
- ΔP measured
- —psi
- Time
- —s
≈ roughly a — HP compressor at 100 psig
To calculate, still needed: the receiver volume, both pressures, the duration.
SCFM = (V · ΔPabs · 60) / (Pstd · t)
Isothermal compression. P_std = 14.5 psia (1 bar abs).
Metered recovery
Receiver sizing and recovery validation across demand cycles.
How to use it
- Enter the supply flow (what the compressor delivers continuously) and the event flow (the short demand spike).
- Give the start and minimum allowable pressures and the event duration: the tool returns the required receiver and the recovery time.
- Fill in “Time between events” to validate recovery — if it is shorter than the recovery time, the receiver cannot recharge in time (shown in red).
- Scenario 2 lets you adjust receiver, supply and pressures with sliders to test variations.
Scenario 1 — required
Result
- Net demand
- —SCFM
- ft³ · L
- —ft³ · —L
- Recovery time
- —s · —min
Scenario 2 — adjustable
Result
- Net demand
- —SCFM
- Recovery time
- —s
Pressure cycle
Tip: enter “Time between events” to see whether recovery fits within the available time.
Volume = (Q_net · t · P_atm) / (60 · ΔP). Scenario 2 validates both volume AND recovery time.
Water removal
Water condensed at the aftercooler and dryer for given inlet/outlet conditions.
System analysis
- Inlet moisture
- —g/kg
- Aftercooler outlet temp
- —°C
- After aftercooler
- —g/kg
- After dryer
- —g/kg
- Dry-air flow
- —kg/h
Water removed (hourly)
- Aftercooler
- —L/h
- Dryer
- —L/h
Remaining water
- Remaining water
- —L/h
Magnus-Tetens psychrometrics. CTD: +25 °F (air) / +10 °F (water).
Air leaks / orifice
Free-air flow through an orifice (leak) and annual cost — pressure & vacuum reference chart.
Regime
Leak to estimate
Leak flow
- Equivalent
- —m³/h · —L/s
- Number of leaks
- —
The chart assumes an idealised orifice (Cd = 1.0). A real sharp-edged leak flows ≈ 0.6–0.7 of this value: adjust the Cd.
Energy cost of the leak
Based on the total leak flow: — SCFM
Estimated annual cost
- Energy wasted
- —kWh/yr
- Wasted power
- —kW
Vacuum regime: the default specific power (18 kW / 100 SCFM) is for a compressor near 7 barg — replace it with your vacuum pump’s.
Indicative cost — editable assumptions (specific power ≈ 18 kW / 100 SCFM near 7 barg, continuous operation, rate to confirm).
Sizing up a leak — field rules of thumb
A real leak has no clean bore: estimate it by its equivalent orifice. Common audit benchmarks, flow shown at 100 psig (≈ 7 barg). Example: a worn quick coupler typically leaks like a 1/16″ orifice — 5 to 6 SCFM, about 1 kW of compression wasted around the clock. “Try” loads the case into the calculator.
| Typical situation | Equivalent orifice | SCFM at 100 psig | |
|---|---|---|---|
| Micro-leak (pinhole, weld pore) — inaudible on the plant floor, found with an ultrasonic detector | 1/64″ (0.4 mm) | 0.350 | |
| Small leak — faint hiss within arm’s reach (thread, gasket, seal) | 1/32″ (0.8 mm) | 1.40 | |
| Typical audible leak — worn quick coupler, tired O-ring | 1/16″ (1.6 mm) | 5.60 | |
| Large leak — clear hiss several metres away (cracked hose, drain stuck open) | 1/8″ (3.2 mm) | 22.4 | |
| Major leak — burst hose, blow gun or drain valve left open | 1/4″ (6.4 mm) | 89.6 |
Indicative benchmarks (Cd = 1.0) — audibility depends on background noise: in a noisy plant (> 80 dB) most leaks below 1/16″ go unnoticed by ear, hence ultrasonic leak surveys.
Reference chart — free-air flow through an orifice
Pressure regime (free-air SCFM, Cd = 1.0)
| Dia. \ psig | 2 | 5 | 10 | 15 | 20 | 25 | 30 | 35 | 40 | 45 | 50 | 60 | 70 | 80 | 90 | 100 | 125 | 150 | 200 |
|---|---|---|---|---|---|---|---|---|---|---|---|---|---|---|---|---|---|---|---|
| 1/64″ | 0.024 | 0.040 | 0.061 | 0.079 | 0.096 | 0.113 | 0.129 | 0.145 | 0.161 | 0.177 | 0.193 | 0.225 | 0.256 | 0.287 | 0.319 | 0.350 | 0.428 | 0.506 | 0.661 |
| 1/32″ | 0.098 | 0.161 | 0.243 | 0.315 | 0.384 | 0.451 | 0.517 | 0.581 | 0.646 | 0.709 | 0.772 | 0.898 | 1.02 | 1.15 | 1.27 | 1.40 | 1.71 | 2.02 | 2.64 |
| 3/64″ | 0.220 | 0.363 | 0.547 | 0.710 | 0.864 | 1.02 | 1.16 | 1.31 | 1.45 | 1.60 | 1.74 | 2.02 | 2.30 | 2.59 | 2.87 | 3.15 | 3.85 | 4.55 | 5.95 |
| 1/16″ | 0.391 | 0.645 | 0.973 | 1.26 | 1.54 | 1.80 | 2.07 | 2.32 | 2.58 | 2.84 | 3.09 | 3.59 | 4.10 | 4.60 | 5.10 | 5.60 | 6.84 | 8.09 | 10.6 |
| 3/32″ | 0.879 | 1.45 | 2.19 | 2.84 | 3.45 | 4.06 | 4.65 | 5.23 | 5.81 | 6.38 | 6.95 | 8.09 | 9.22 | 10.3 | 11.5 | 12.6 | 15.4 | 18.2 | 23.8 |
| 1/8″ | 1.56 | 2.58 | 3.89 | 5.05 | 6.14 | 7.22 | 8.27 | 9.30 | 10.3 | 11.3 | 12.4 | 14.4 | 16.4 | 18.4 | 20.4 | 22.4 | 27.4 | 32.4 | 42.3 |
| 3/16″ | 3.52 | 5.80 | 8.75 | 11.4 | 13.8 | 16.2 | 18.6 | 20.9 | 23.2 | 25.5 | 27.8 | 32.3 | 36.9 | 41.4 | 45.9 | 50.4 | 61.6 | 72.8 | 95.2 |
| 1/4″ | 6.25 | 10.3 | 15.6 | 20.2 | 24.6 | 28.9 | 33.1 | 37.2 | 41.3 | 45.4 | 49.4 | 57.5 | 65.6 | 73.6 | 81.6 | 89.6 | 110 | 129 | 169 |
| 3/8″ | 14.1 | 23.2 | 35.0 | 45.4 | 55.3 | 65.0 | 74.4 | 83.7 | 93.0 | 102 | 111 | 129 | 148 | 166 | 184 | 202 | 246 | 291 | 381 |
| 1/2″ | 25.0 | 41.3 | 62.3 | 80.8 | 98.3 | 116 | 132 | 149 | 165 | 182 | 198 | 230 | 262 | 294 | 326 | 358 | 438 | 518 | 677 |
| 5/8″ | 39.1 | 64.5 | 97.3 | 126 | 154 | 180 | 207 | 232 | 258 | 284 | 309 | 359 | 410 | 460 | 510 | 560 | 684 | 809 | 1,058 |
| 3/4″ | 56.3 | 92.8 | 140 | 182 | 221 | 260 | 298 | 335 | 372 | 408 | 445 | 518 | 590 | 662 | 734 | 806 | 986 | 1,165 | 1,523 |
| 7/8″ | 76.6 | 126 | 191 | 247 | 301 | 354 | 405 | 456 | 506 | 556 | 606 | 704 | 803 | 901 | 999 | 1,097 | 1,341 | 1,586 | 2,073 |
| 1″ | 100 | 165 | 249 | 323 | 393 | 462 | 529 | 595 | 661 | 726 | 791 | 920 | 1,049 | 1,177 | 1,305 | 1,433 | 1,752 | 2,071 | 2,708 |
| 1 1/8″ | 127 | 209 | 315 | 409 | 497 | 585 | 670 | 753 | 837 | 919 | 1,001 | 1,164 | 1,328 | 1,490 | 1,652 | 1,814 | 2,217 | 2,621 | 3,427 |
| 1 1/4″ | 156 | 258 | 389 | 505 | 614 | 722 | 827 | 930 | 1,033 | 1,134 | 1,236 | 1,438 | 1,639 | 1,839 | 2,039 | 2,239 | 2,738 | 3,236 | 4,231 |
| 1 3/8″ | 189 | 312 | 471 | 611 | 743 | 873 | 1,000 | 1,125 | 1,250 | 1,373 | 1,495 | 1,739 | 1,983 | 2,225 | 2,467 | 2,709 | 3,312 | 3,915 | 5,120 |
| 1 1/2″ | 225 | 371 | 560 | 727 | 884 | 1,040 | 1,190 | 1,339 | 1,487 | 1,634 | 1,780 | 2,070 | 2,360 | 2,648 | 2,936 | 3,224 | 3,942 | 4,660 | 6,093 |
| 1 3/4″ | 306 | 505 | 763 | 989 | 1,204 | 1,415 | 1,620 | 1,822 | 2,024 | 2,223 | 2,422 | 2,818 | 3,213 | 3,605 | 3,997 | 4,389 | 5,366 | 6,342 | 8,293 |
| 2″ | 400 | 660 | 996 | 1,292 | 1,572 | 1,848 | 2,116 | 2,380 | 2,644 | 2,904 | 3,164 | 3,680 | 4,196 | 4,708 | 5,220 | 5,732 | 7,008 | 8,284 | 10,832 |
Vacuum regime (free-air SCFM, Cd = 1.0)
| Dia. \ in Hg | 2 | 4 | 6 | 8 | 10 | 12 | 14 | 18 | 24 |
|---|---|---|---|---|---|---|---|---|---|
| 1/64″ | 0.019 | 0.026 | 0.032 | 0.037 | 0.041 | 0.045 | 0.049 | 0.055 | 0.063 |
| 1/32″ | 0.075 | 0.105 | 0.128 | 0.148 | 0.165 | 0.181 | 0.195 | 0.220 | 0.252 |
| 1/16″ | 0.299 | 0.422 | 0.512 | 0.594 | 0.660 | 0.723 | 0.781 | 0.879 | 1.01 |
| 1/8″ | 1.20 | 1.69 | 2.05 | 2.38 | 2.64 | 2.89 | 3.13 | 3.52 | 4.03 |
| 1/4″ | 4.78 | 6.75 | 8.19 | 9.50 | 10.6 | 11.6 | 12.5 | 14.1 | 16.1 |
| 3/8″ | 10.8 | 15.2 | 18.4 | 21.4 | 23.8 | 26.0 | 28.1 | 31.6 | 36.3 |
| 1/2″ | 19.1 | 27.0 | 32.8 | 38.0 | 42.3 | 46.3 | 50.0 | 56.3 | 64.5 |
| 5/8″ | 29.9 | 42.2 | 51.2 | 59.4 | 66.0 | 72.3 | 78.1 | 87.9 | 101 |
| 3/4″ | 43.0 | 60.8 | 73.7 | 85.5 | 95.1 | 104 | 113 | 127 | 145 |
| 7/8″ | 58.6 | 82.7 | 100 | 116 | 129 | 142 | 153 | 172 | 198 |
| 1″ | 76.5 | 108 | 131 | 152 | 169 | 185 | 200 | 225 | 258 |
Computed values: SCFM = f(P) × (diameter in inches)². The cell nearest your input is highlighted.
Flow from pressure drop
Inverse chart: diameter, length and pressure drop measured between two points → estimated flow (consumption), in 5-psi steps.
Flow passing through — per pressure-drop step Total loop consumption — per pressure-drop step
Open line: the full flow travels through the measured run. The flow shown is the consumption passing between the two points. Looped network (CAGI): a loop reduces the pressure drop by about half → for the same measured drop, the total consumption is higher than an open line. The flow shown is that TOTAL consumption; velocity is an upper bound (full flow). CAGI sets no “Q/2”.
| Pressure drop (psi) | Flow (SCFM) Total flow (SCFM) | Velocity (ft/s) |
|---|---|---|
| 25 | — | — |
| 20 | — | — |
| 15 | — | — |
| 10 | — | — |
| 5 | — | — |
| < 1 | — | — |
Inner diameter used —mm · —in
Measure the pressure drop between two points of the network: the flow shown is the approximate consumption passing through. Standardized inner diameters (steel ASME B36.10, EQOfluids aluminum chart). Darcy–Weisbach, Swamee–Jain friction, air @ 20 °C / 1 bar abs (ISO 1217). Working pressure affects the result (air density). Incompressible model: beyond about 10 % of absolute pressure, the estimate becomes conservative. Velocity red if > 35 ft/s — the required flow becomes unrealistic for this diameter.
Indicative estimates — validate all results before any technical decision.